- Soohyun Lee, Seoul National University
- Seokhyeon Park, Seoul National University
- Minsuk Chang, Georgia Institute of Technology
- Jinwook Seo, Seoul National University
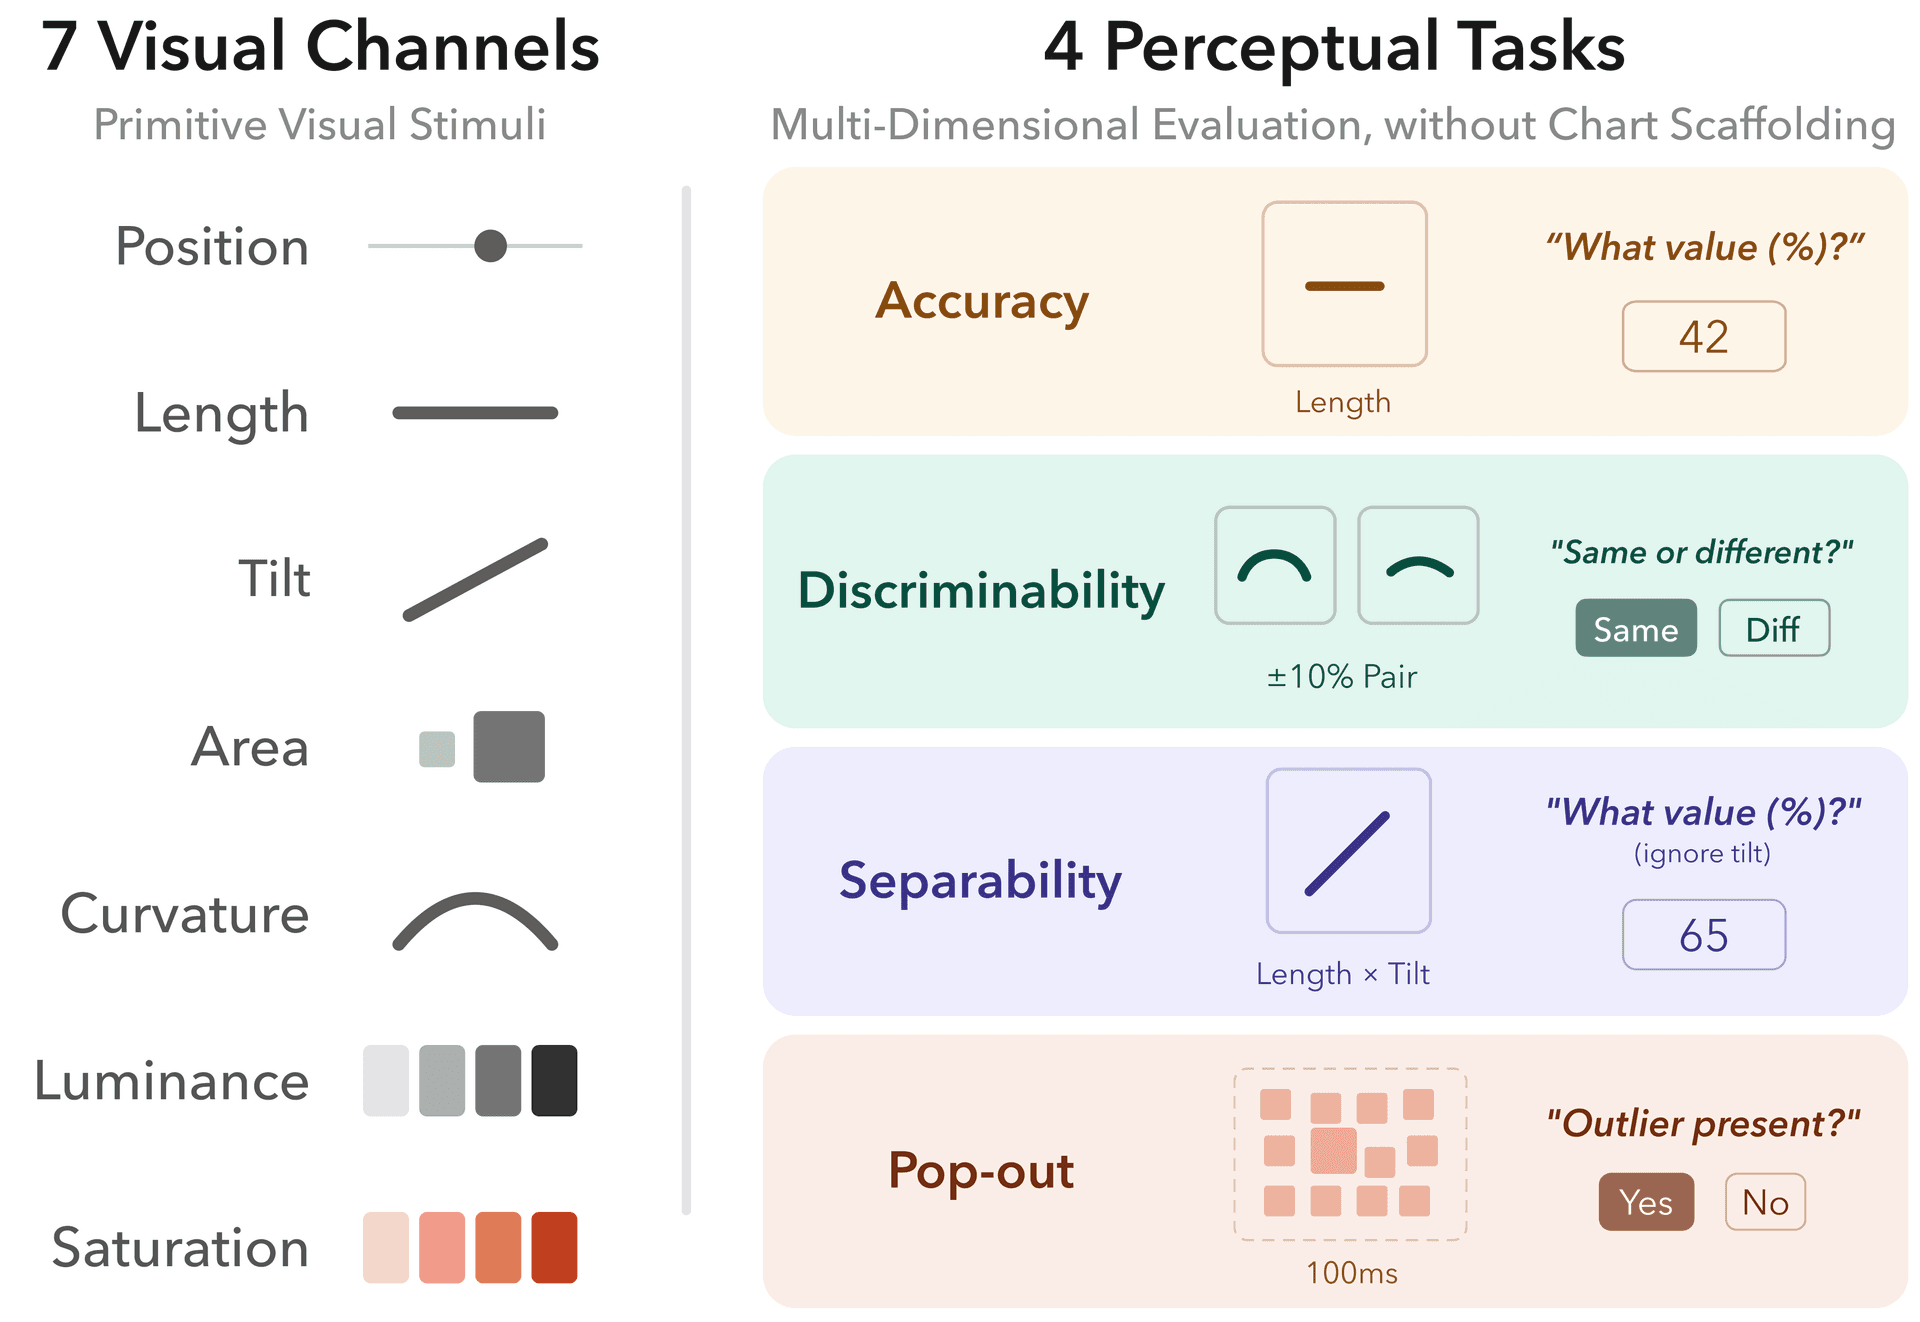
Established rankings of visual channels have largely been based on one question: how accurately a value can be read from a complete chart. We evaluate seven channels (position, length, tilt, area, curvature, luminance, and saturation) using primitive visual stimuli stripped of chart scaffolding, across four perceptual tasks: accuracy, discriminability, separability, and pop-out.
Rather than proposing another universal ranking, this work characterizes channel effectiveness across multiple perceptual dimensions and provides a scenario-driven basis for selecting visual channels.
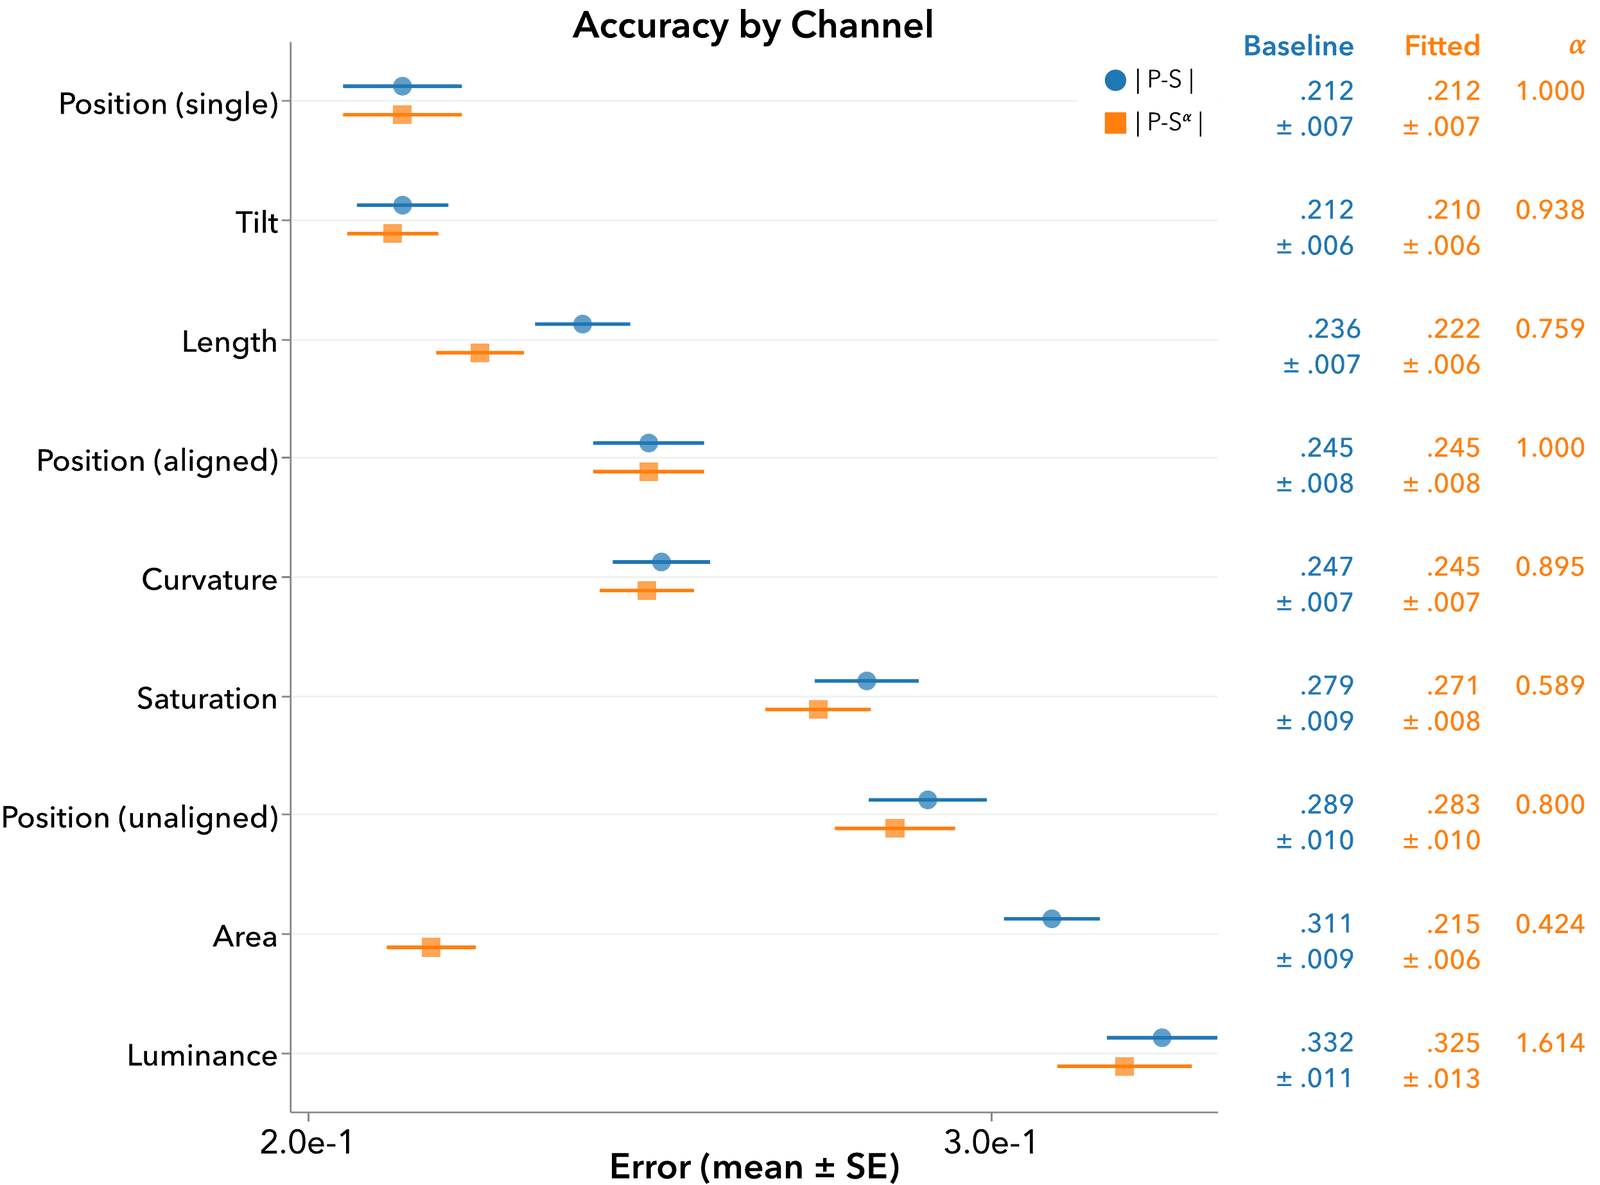
Accuracy depends on reference frames. Single position was the most accurate channel, largely because it offers a fixed anchor to read against, and accuracy degraded step by step as positional references weakened. Tilt, judged in isolation, was statistically equivalent to single position. Much of area's notorious inaccuracy also disappears after a simple power-law calibration (α = 0.42): people compress area in a consistent way, as if judging a square by its side length, so a single fixed exponent undoes most of the bias.
Discriminability moves along the value range. Area and length discriminate most finely at low values, luminance climbs from near the bottom to first place close to the bright end, and saturation is the only channel that follows textbook Weber behavior throughout. We capture these patterns with our Anchored Harmonic Weber model, which extends classic Weber's law (larger values need larger differences to be noticed) with sharper discrimination near the ends of a channel's range.

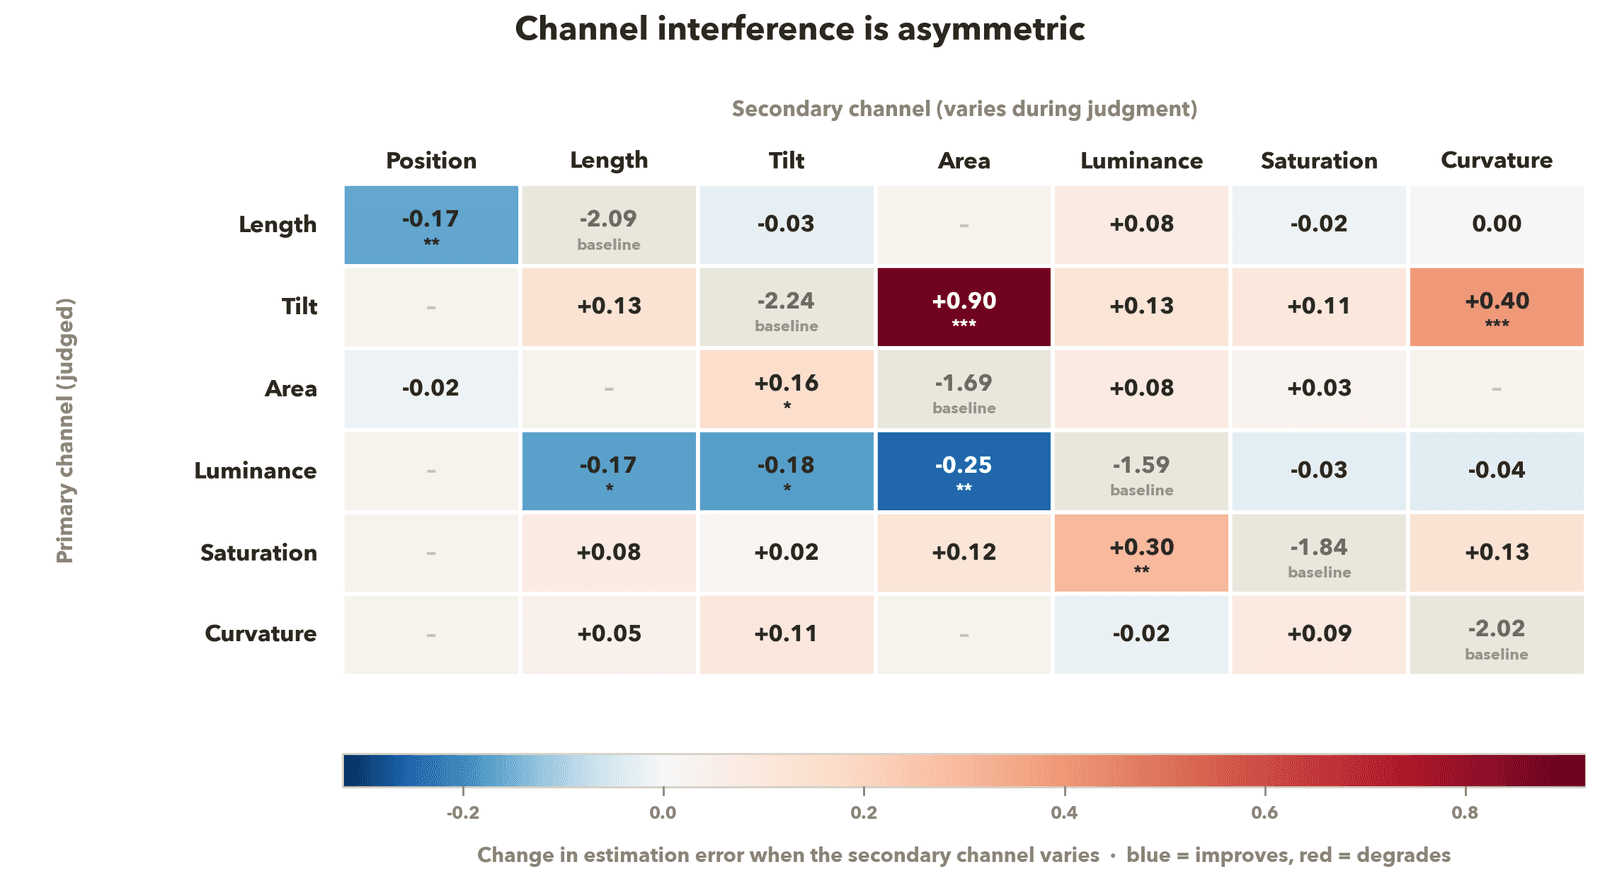
Interference between channels is asymmetric. In the separability task, tilt judgments fall to near chance when area varies, yet the reverse pairing costs little. Luminance disrupts saturation but not the other way around, and length stays robust against every secondary channel we tested.
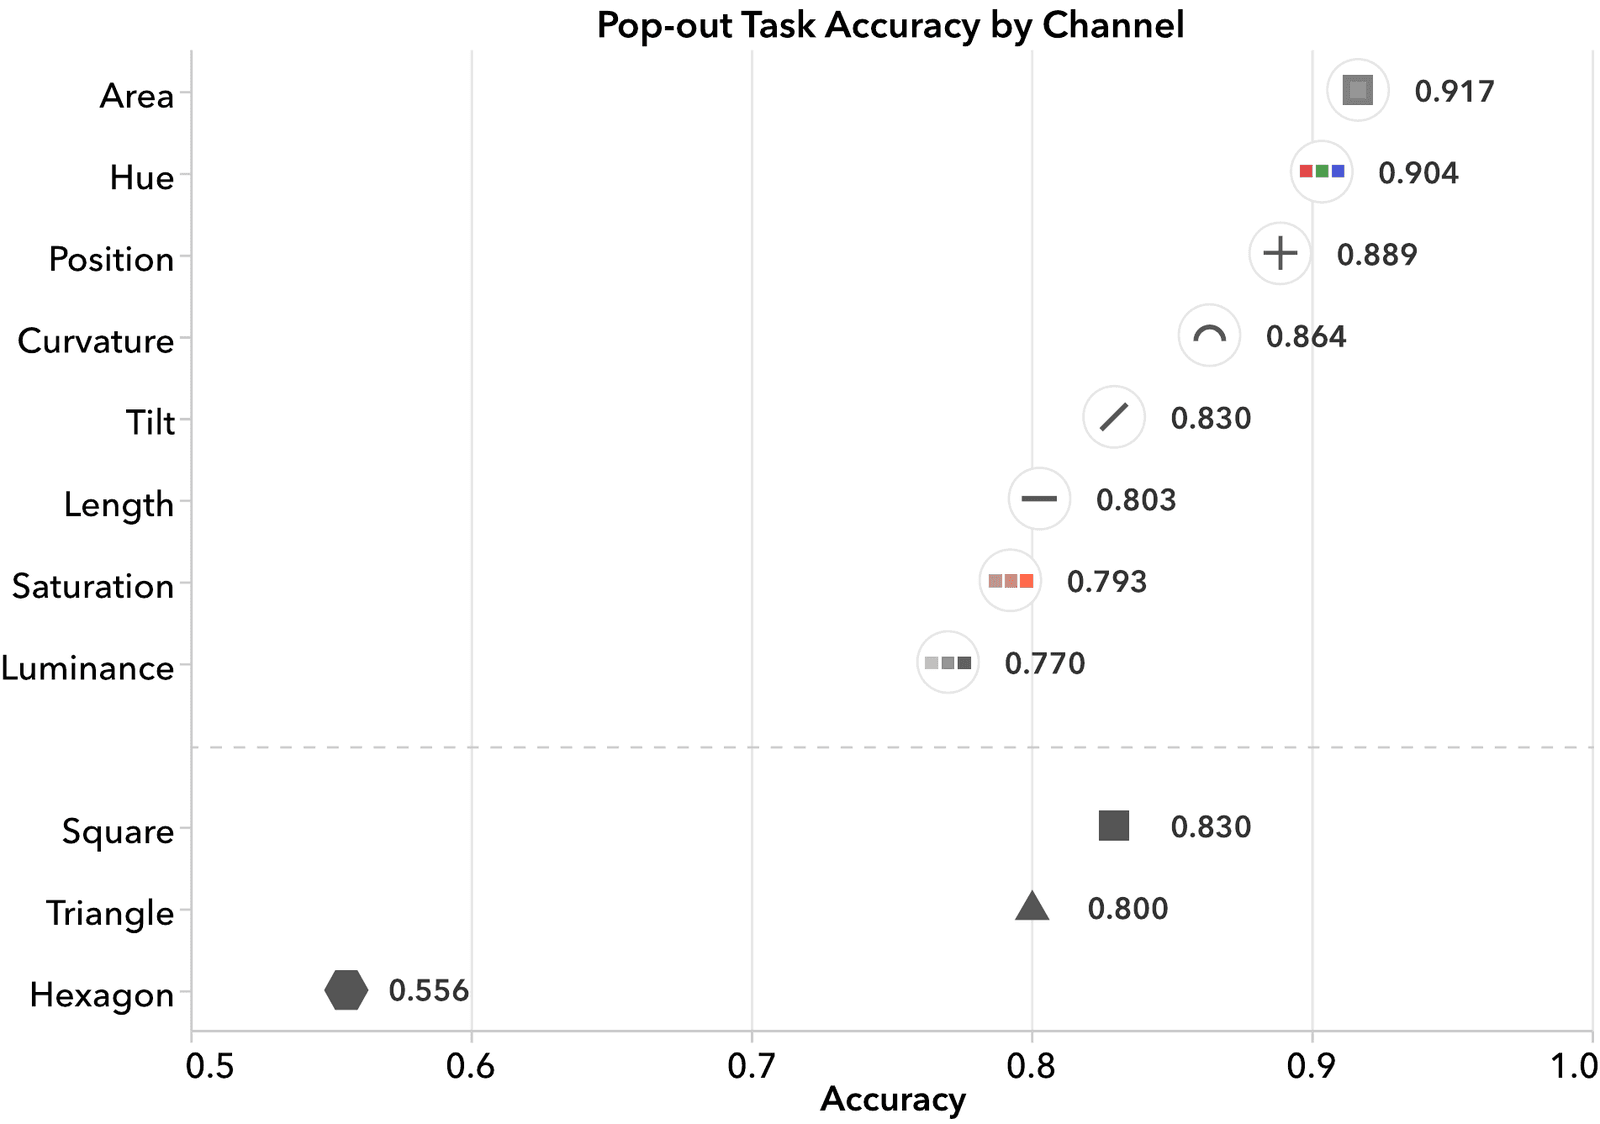
Reading a value and spotting one are different skills. In the pop-out task, area was detected best under 100 ms exposure (0.92) despite its poor estimation accuracy, while length, excellent for estimation, was only moderate (0.80).
No single ranking captures these results, so here is what we learned about each channel:
Position — the accuracy benchmark when a stable anchor is available, and strong for pop-out; its advantage fades as positional references weaken.
Length — excellent for estimation and robust to every interfering channel we tested, but only moderate for pop-out.
Tilt — as precise as single position in isolation; falls to near chance when area varies nearby.
Area — weak raw accuracy that calibration largely repairs; the finest discrimination over much of its range; the best pop-out.
Curvature — near-linear estimation, with Weber-like discrimination until the arc approaches a semicircle.
Luminance — weak for estimation even after correction; discriminates sharply only near white; unusually robust under interference.
Saturation — the only channel with textbook Weber behavior across its full range, but weak for estimation and easily disrupted by luminance.
Which of these profiles matters most depends on the scenario: how precisely values must be read, how finely they must be distinguished, what else varies in the display, and how quickly information must register.
In an earlier short paper, we asked whether image embedding models perceive these channels the way people do. Vision models are increasingly used for chart understanding (classification, captioning, and question answering), yet most benchmarks measure task performance rather than perception of the underlying graphical elements. We therefore built an evaluation framework and applied it to CLIP (RN50x64, ViT-B/32, and ViT-L/14@336px) over six magnitude channels, using embedding linearity as a proxy for accuracy and the distance between consecutive embeddings as a proxy for discriminability.
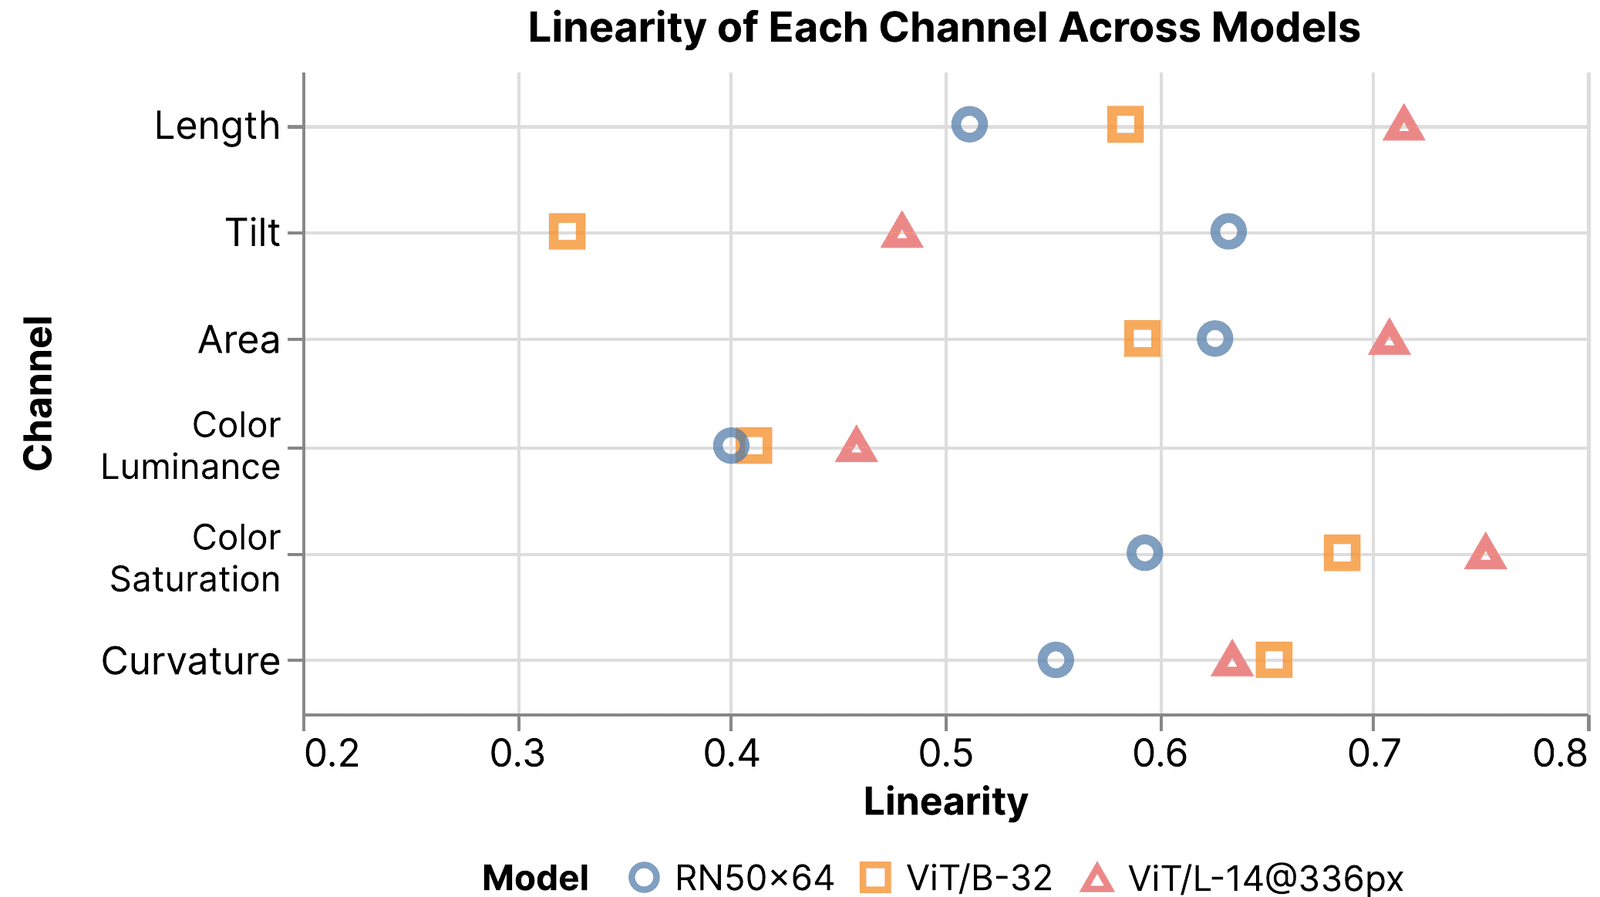
- CLIP does not rank channels like humans. Saturation ranks highest while luminance and tilt sit lowest, and linearity stays around 0.6 for most channels, far from the near-linear response that accurate value reading would require.
- Each channel has its own perceptual anchors, often in different places than ours. Distances spike at short lengths (a Weber-like pattern shared with humans), and length splits into roughly four perceptual stages. Tilt anchors at 45° (humans anchor around the cardinal orientations instead), and luminance reacts mainly near its dark and bright extremes.
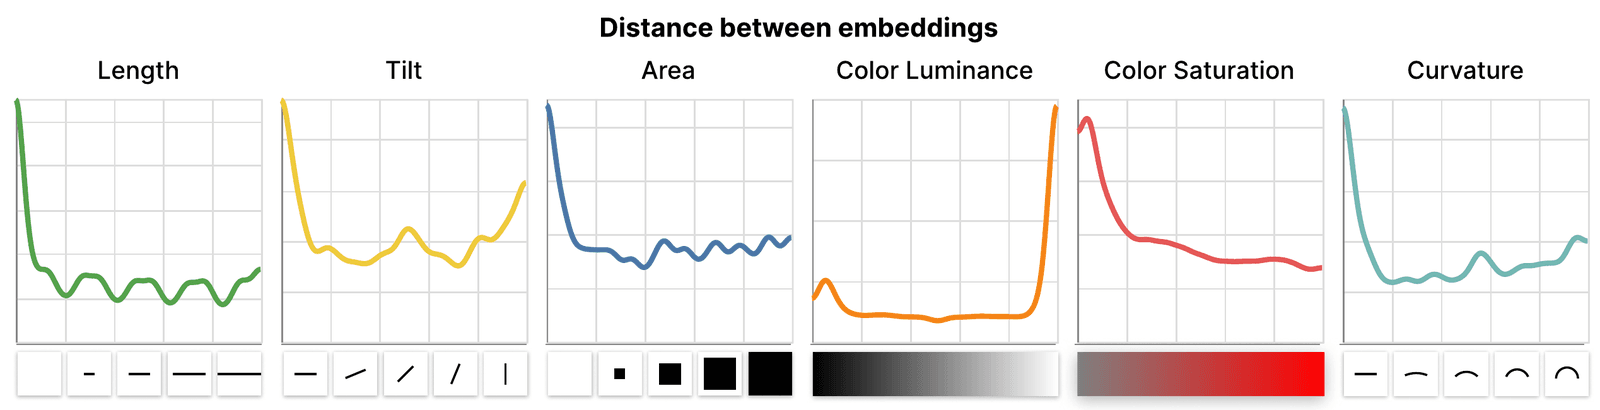
- Accuracy and discriminability trade off. We observed that accuracy can be lower where a certain amount of discriminability exists; the two goals do not automatically come together.
- Match the encoder to the goal. Chart question answering needs precise, near-linear channel reading, while chart captioning benefits from perception that mirrors humans. Neither should be taken for granted from a general-purpose encoder.